Doctrine 2 extension offers a number of logger to view details of executed sql queries.
In this post I'll show how to implement a FirePHP logger.
Step 1:
If you try to call FirePHP in the code you get this error:
Error: FirePHP Class not found
To fix this, declare FirePHP in the file Application/autoload_classmap.php
<?php
return array(
    'FirePHP' => 'FirePHPCore/FirePHP.class.php',
);
And in file Application/Module.php change the getAutoloaderConfig function to load the class map file:
<?php
public function getAutoloaderConfig()
{
    return array(
        'Zend\Loader\ClassMapAutoloader' => array(
            __DIR__ . '/autoload_classmap.php',
        ),
        'Zend\Loader\StandardAutoloader' => array(
            'namespaces' => array(
                __NAMESPACE__ => __DIR__,
            ),
        ),
    );
}
Step 2:
Create the profiler class.
File: Application/Profiler/FirePhpProfiler.php
<?php
namespace Application\Profiler;
class FirePhpProfiler implements \Doctrine\DBAL\Logging\SQLLogger
{
    private $enabled      = true;
    private $start        = 0;
    private $end          = 0;
    private $queries      = array();
    private $currentQuery = null;
    /**
     * $logger FirePHP
     */
    private $logger;
    public function __construct()
    {
        $this->logger    = new \FirePHP();
        $this->queries[] = array('Time', 'Query', 'Parameters');
    }
    /**
     * {@inheritdoc}
     */
    public function startQuery($sql, array $params = null, array $types = null)
    {
        if (! $this->start) {
            $this->start = \microtime(true);
        }
        $this->currentQuery            = new \stdClass();
        $this->currentQuery->sql       = $sql;
        $this->currentQuery->params    = $params;
        $this->currentQuery->types     = $types;
        $this->currentQuery->startTime = \microtime(true);
    }
    /**
     * {@inheritdoc}
     */
    public function stopQuery()
    {
        $executionTime = \microtime(true) - $this->currentQuery->startTime;
        $this->queries[] = array(
            number_format($executionTime, 4),
            $this->currentQuery->sql,
            $this->currentQuery->params,
        );
        $this->end = \microtime(true);
    }
    /**
     * showTable dispaly FirePHP table
     */
    public function showTable()
    {
        if (headers_sent()) {
            return;
        }
        if (! empty($this->queries) && count($this->queries) > 1) {
            $this->logger->table(
                sprintf(
                    'Doctrine Queries (%d @ %s sec)',
                    count($this->queries) - 1,
                    number_format($this->end - $this->start, 4)
                ),
                $this->queries
            );
        }
    }
}
Step 3:
Add the created profiler to service manager
File: Application/Module.php
<?php
public function getServiceConfig()
{
    return array(
        'invokables' => array(
            'FirePhpProfiler' => 'Application\Profiler\FirePhpProfiler',
        ),
    );
}
Step 4:
Add the profiler to Doctrine EntityManager and attach new event to launch the profiler.
File: Application/Module.php
<?php
use Zend\Mvc\MvcEvent;
public function onBootstrap(MvcEvent $e)
{
$serviceManager = $e->getApplication()->getServiceManager();
$eventManager = $e->getApplication()->getEventManager();
$serviceManager->get('doctrine.entitymanager.orm_default')
->getConfiguration()->setSQLLogger($serviceManager->get('FirePhpProfiler'));
$eventManager->attach(
MvcEvent::EVENT_FINISH,
function ($e) use ($serviceManager) {
$profiler = $serviceManager->get('FirePhpProfiler');
$profiler->showTable();
},
100
);
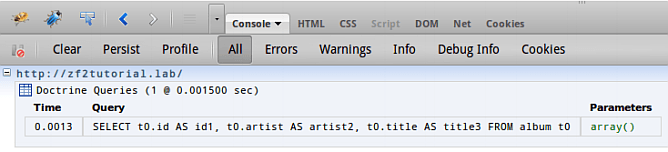
}Finally:
The end result show in Firebug: